AI Referrals Went From the Worst Retail Channel to the Best in Twelve Months. Here Is the Full Series.
Adobe has published AI referral data for US retail every quarter since late 2024. Lined up end to end, the series shows a channel that grew 14x, flipped from converting 38% worse to 60% better, and is still mostly invisible to the stores receiving it.
Product Gale Team
AI Referrals Went From the Worst Retail Channel to the Best in Twelve Months. Here Is the Full Series.
Every few months Adobe publishes a new headline number about AI traffic to US retail sites, and every few months it gets quoted on its own. "Up 693%." "Converts 54% better." Each one is true. None of them is the story.
The story only appears when you line the releases up end to end. Adobe Analytics sits on more than a trillion visits to US retail sites, including over 200 of the Top 2000 retailers, and it has reported the same AI referral measures since October 2024. That gives us a 21-month series on one method. We pulled every published figure, put them in order, and did the arithmetic the press releases skip.
Three things fall out. The growth rate is slowing but the volume is not. The channel crossed from worst to best on conversion inside a single year. And every number in the series is a floor, because most AI visits never carry a referrer.
1. Growth is decelerating. Volume is not.
Here is every year-over-year growth figure Adobe has published for AI referral traffic to US retail sites, in date order.
| Period | AI traffic, YoY | Source date |
|---|---|---|
| Holiday 2024 (Nov to Dec) | +1,300% | Oct 2025 |
| December 2025 | +1,151% | Apr 2026 |
| Holiday 2025 (Nov to Dec) | +693% | Jan 2026 |
| Q1 2026 (Jan to Mar) | +393% | Apr 2026 |
| March 2026 | +269% | Apr 2026 |
| January to May 2026 | +235% | Jun 2026 |
| May 2026 | +138% | Jun 2026 |
| Prime Day event (Jun 23 to 26, 2026) | +89% | Jun 2026 |
| July 2026 | +62% | Aug 2026 |
| Holiday 2026 (forecast) | +130% | Sep 2026 |
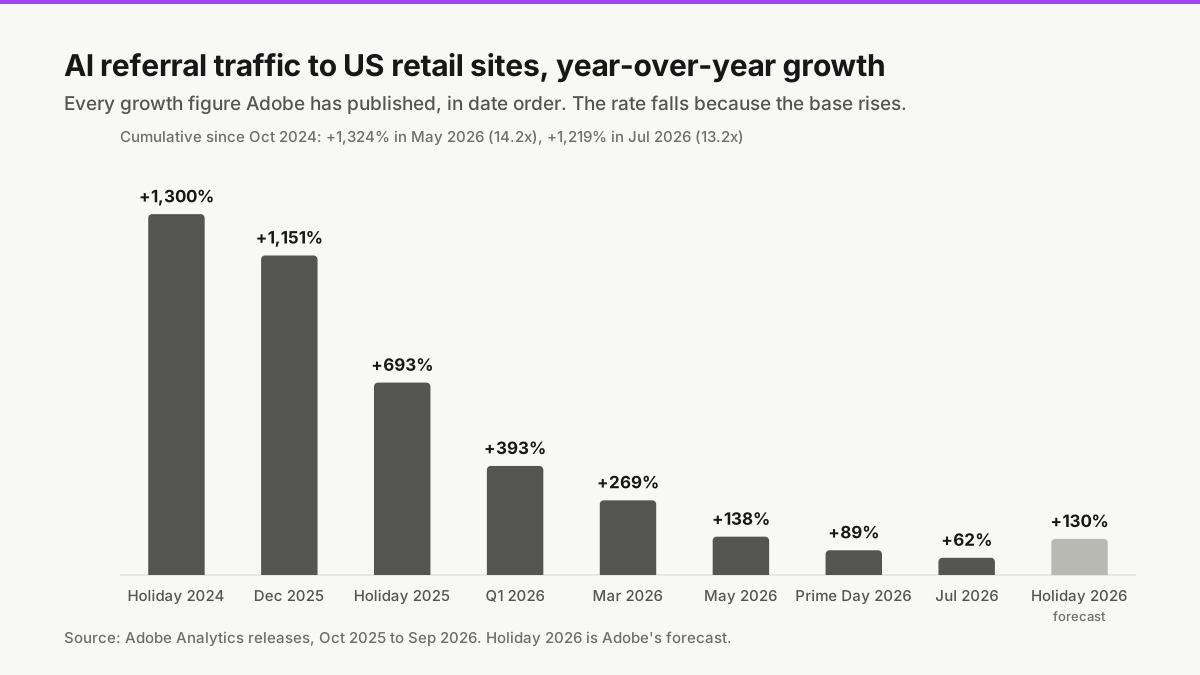
Read quickly, that looks like a fad running out of steam: 1,300% down to 62% in eighteen months. Read correctly, it is what every compounding channel looks like once the base stops being tiny. The 62% in July 2026 is growth on top of a July 2025 that was itself several hundred percent above July 2024.
The cleaner measure is the cumulative one, which Adobe states twice. Against the October 2024 baseline, AI referral share of retail visits was up 1,324% in May 2026 and 1,219% in July 2026. That is a 14.2x multiple in 19 months, easing to 13.2x in the summer lull.
A 14.2x multiple over 19 months works out to a steady 15% per month, which means the channel doubled roughly every five months for a year and a half. If a store's AI share were 1% of sessions today and that rate held, it would be about 5% in a year and over 12% in eighteen months. We would not bet on the rate holding; Adobe's own holiday forecast of +130% implies a slower pace. But the direction of travel has not changed in any period Adobe has reported.
2. The conversion flip, dated
This is the part that should change how a merchant files this channel. Adobe compares AI-referred visitors against non-AI traffic (paid search, email, social and the rest) on the same sites in the same month. Here is every comparison they have published.
| Period | AI visitors convert | Revenue per AI visit |
|---|---|---|
| March 2025 | 38% worse | about 56% lower |
| Prime Day 2025 (July) | 23% worse | not reported |
| Thanksgiving 2025 | 54% better | not reported |
| Black Friday 2025 | 38% better | not reported |
| Holiday 2025 (season) | 31% better | up 254% YoY |
| February 2026 | not reported | 26% higher |
| March 2026 | 42% better | 37% higher |
| May 2026 | 54% better | 53% higher |
| Prime Day 2026 (June) | 40% better | not reported |
| July 2026 | 60% better | 53% higher |
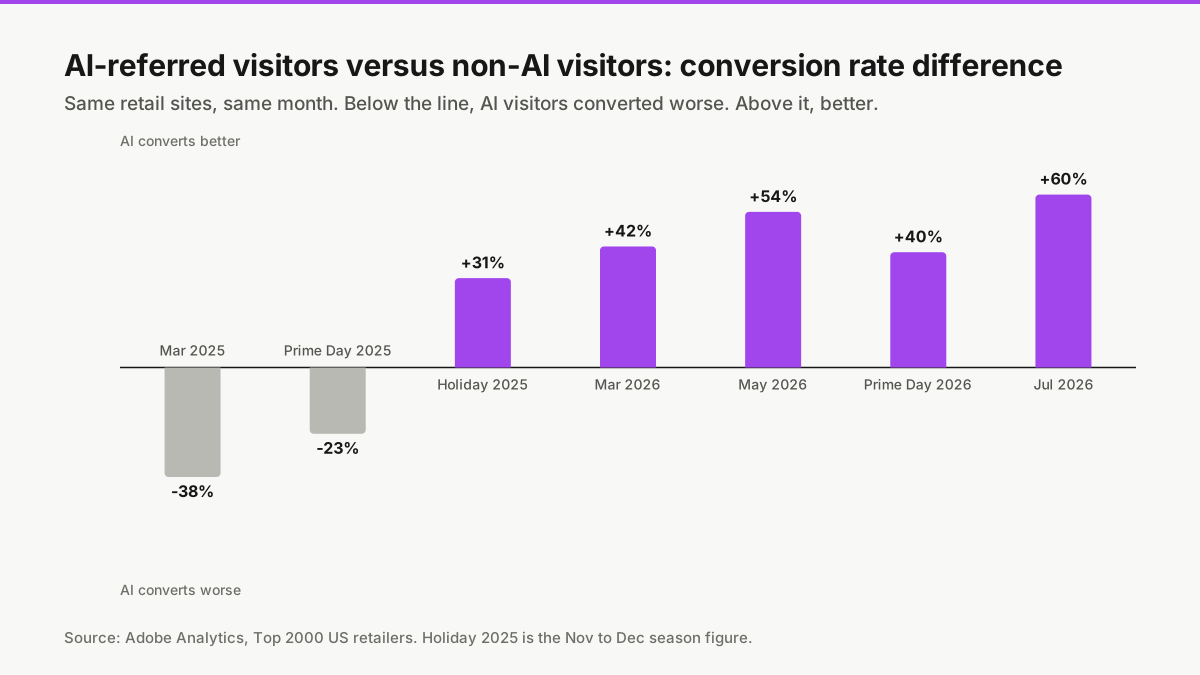
The crossing point sits somewhere between July and November 2025. By Adobe's count, July 2026 was the eleventh straight month in which AI referrals out-converted everything else.
The revenue-per-visit line is even starker, and the starting point is the number nobody quotes. In May 2025, Adobe says, a non-AI visit was worth 128% more than an AI visit. Invert that and an AI visit was worth about 44 cents on the non-AI dollar. Twelve months later an AI visit was worth 1 dollar 53. The relative value of an AI visitor rose about 3.5x in a year.
Two mechanisms explain most of it, and both are visible in Adobe's engagement data. First, the shopper arriving from an assistant has already done the comparison. Second, the assistant sends them to the right page. Shopify's Q2 2026 call put a number on that: half of AI-referred sessions land directly on a product page, 2.5x the rate for traditional search.
| Engagement measure, AI vs non-AI | March 2026 | May 2026 |
|---|---|---|
| Time on site | +48% | +53% |
| Pages per visit | +13% | +23% |
| Bounce rate | 32% lower | 36% lower |
| Engagement rate | +12% | +15% |
One detail in there predicted the flip months before it happened. Adobe reports that AI bounce rates "have held in a tight 17 to 20% band for more than a year while non-AI rates hover near 27%." The intent was high from the start. What changed in 2025 was that retailers' pages stopped losing the shopper after the assistant delivered them.
3. What this is worth to one store
Adobe never publishes AI traffic as a share of visits. Other panels do, and they disagree with each other because they sample different stores.
| Source | What it measures | AI share |
|---|---|---|
| Semrush, 50,000 sites, 2025 | All AI referrals, median across sites | 0.14% of visits |
| SE Ranking, 101,574 sites, May 2026 | ChatGPT referrals | 0.32% of visits |
| Bain with Similarweb, Nov 2025 | AI referrals to retailers | under 1% of total, up to 25% of referral traffic |
| Attrifast, 54 Stripe stores, May 2026 | AI incl. recovered no-referrer visits | 4.1% of sessions, 5.8% of revenue |
Take a plain DTC store: 60,000 sessions a month, a 2% conversion rate, an 85 dollar average order. That is 1,200 orders and about 102,000 dollars a month. Apply Adobe's May 2026 uplift of 54% on conversion to the AI slice and you get this.
| AI share of sessions | AI sessions | Orders from AI | Revenue from AI |
|---|---|---|---|
| 0.5% | 300 | 9 | about $790 |
| 1% | 600 | 18 | about $1,570 |
| 3% | 1,800 | 55 | about $4,700 |
| 5% | 3,000 | 92 | about $7,900 |
At today's share this is not a budget line. At the share Attrifast's stores already report, it is the price of a hire. The reason to measure it now is the doubling time, not the current total.
4. Every number above is a floor
Adobe counts an AI visit when a shopper clicks a link that carries a referrer. A large share of AI visits do not.
- Loamly's analysis of 446,405 visits across its customer sites found that 70.6% of confirmed AI visits arrived with no referrer and were filed as Direct in GA4.
- Attrifast, matching server-side sessions to Stripe payments across 200 sites, found that a median 34% of GA4 Direct traffic was AI-referred, and 22% on ecommerce sites specifically.
- Similarweb states the problem in one line: referral counts are "a floor, not a ceiling."
- Google AI Overviews and AI Mode generate no trackable referral session at all. Shopify classifies AI Overview clicks as organic search.
If seven in ten AI visits are invisible, the visible count understates the true one by about 3.4x. Nobody can prove the exact multiplier for a given store, which is the point: the only way to know is to tag the traffic at the edge, where the user agent and the landing pattern are still readable.
5. Where the sources disagree, and why
The conversion lift is not universal, and it would be dishonest to pretend otherwise.
| Study | Sample | AI referrals convert |
|---|---|---|
| Adobe, 2026 | Top 2000 US retailers, 1T+ visits | 40% to 60% better than non-AI |
| Shopify, Q1 2026 | Storefronts on the platform | nearly 50% better than organic search, on product page sessions |
| 180 Marketing, 2025 | 94 seven and eight figure DTC brands | 31% better than non-branded organic |
| Attrifast, May 2026 | 54 small Stripe stores | ChatGPT 1.7% vs organic 2.1%, worse |
| Kaiser and Schulze, Marketing Science 2026 | 973 sites, Aug 2024 to Jul 2025 | worse than every channel except paid social |
The split follows two variables. Large retailers in 2026 see the lift. Small stores and any window ending before mid-2025 do not. Adobe's own series shows the crossing happening in the second half of 2025, so a study that stops in July 2025 is measuring the channel before it turned.
There is also a mix effect that favours large retailers. Shopify's Q2 2026 call reported that 75% of AI-attributed orders came from outside its top 100 product categories. Assistants route specific, long-tail demand. A store whose product pages state the specific facts a shopper asked about gets that order; a store whose pages do not gets skipped, and the skip leaves no trace in any analytics tool.
What to do with this
- Count what you can see. Filter your analytics for chatgpt.com, perplexity.ai, gemini.google.com, copilot.microsoft.com and claude.ai as referrers. Compare their conversion rate to organic search. Most stores have never looked.
- Estimate what you cannot. Look at Direct traffic landing on deep product pages with no campaign parameters. That bucket has grown for a reason.
- Tag at the edge. A tracker that reads the user agent and landing pattern before the browser does catches the no-referrer visits and the crawler fetches that precede them. That is what Product Gale's traffic tag records, and the first 30 days are free.
- Then price it. Multiply the visible AI sessions by the floor multiplier you measured, apply your own AI conversion rate, and put the monthly figure next to your search and social lines. It will be small. Check again in five months.
Sources
- Adobe, holiday 2025 results, 7 Jan 2026: news.adobe.com
- Adobe, Q1 2026 AI traffic and readability, 16 Apr 2026: business.adobe.com
- Adobe Digital Insights, Quarterly AI Traffic Report, April 2026 (PDF): business.adobe.com
- Adobe Digital Insights, Q3 AI Traffic Trends Report, June 2026 (PDF): business.adobe.com
- Adobe, Prime Day 2026, 29 Jun 2026: business.adobe.com
- Adobe, holiday 2026 forecast, 28 Sep 2026: news.adobe.com
- Digital Commerce 360 on Adobe's holiday 2025 and July 2026 AI data: 13 Jan 2026, 19 Aug 2026
- Shopify, AI-referred shoppers convert better and spend more, 11 May 2026: shopify.com
- Shopify Q2 2026 earnings call transcript, 5 Aug 2026: fool.com
- Semrush, traffic channel mix study, 27 Apr 2026: semrush.com
- SE Ranking, ChatGPT referral traffic May 2026, 9 Jul 2026: seranking.com
- Bain, agentic AI in retail, 13 Nov 2025: bain.com
- Attrifast, AI search revenue benchmark, 26 May 2026: attrifast.com
- 180 Marketing, ChatGPT vs organic conversion across 94 stores, 23 Feb 2026: 180marketing.com
- Kaiser and Schulze, ChatGPT referrals to e-commerce websites, Marketing Science 2026: pubsonline.informs.org
- Loamly, hidden AI traffic in Google Analytics, Feb 2026, as reported by Seresa
- Similarweb, AI referral traffic by industry, 3 Sep 2026: aisearch.similarweb.com
Keep reading
AI Overviews Cut Clicks by 38%. For Shopping Queries, They Mostly Do Not Appear.
A randomized experiment, Pew, Similarweb, Ahrefs, Seer and BrightEdge all measured what Google's AI answers did to clicks in 2025 and 2026. The headline losses are real and they belong to publishers. We model what a product store actually loses, and where the shopping click went instead.
AI Shoppers Are Already Buying: Your Analytics Just Can't See Them
AI referral traffic to ecommerce grew 4,700% year over year and now converts better than traditional search. Here's why almost none of it shows up in your reports, and what that blind spot costs.